Continuous Temperature Mapping: GxP Compliance with AI
Discover how AI-powered Continuous Temperature Mapping (cTM) revolutionizes pharmaceutical GxP compliance with real-time monitoring and automated reporting.

AI-powered GxP temperature and environmental mapping.
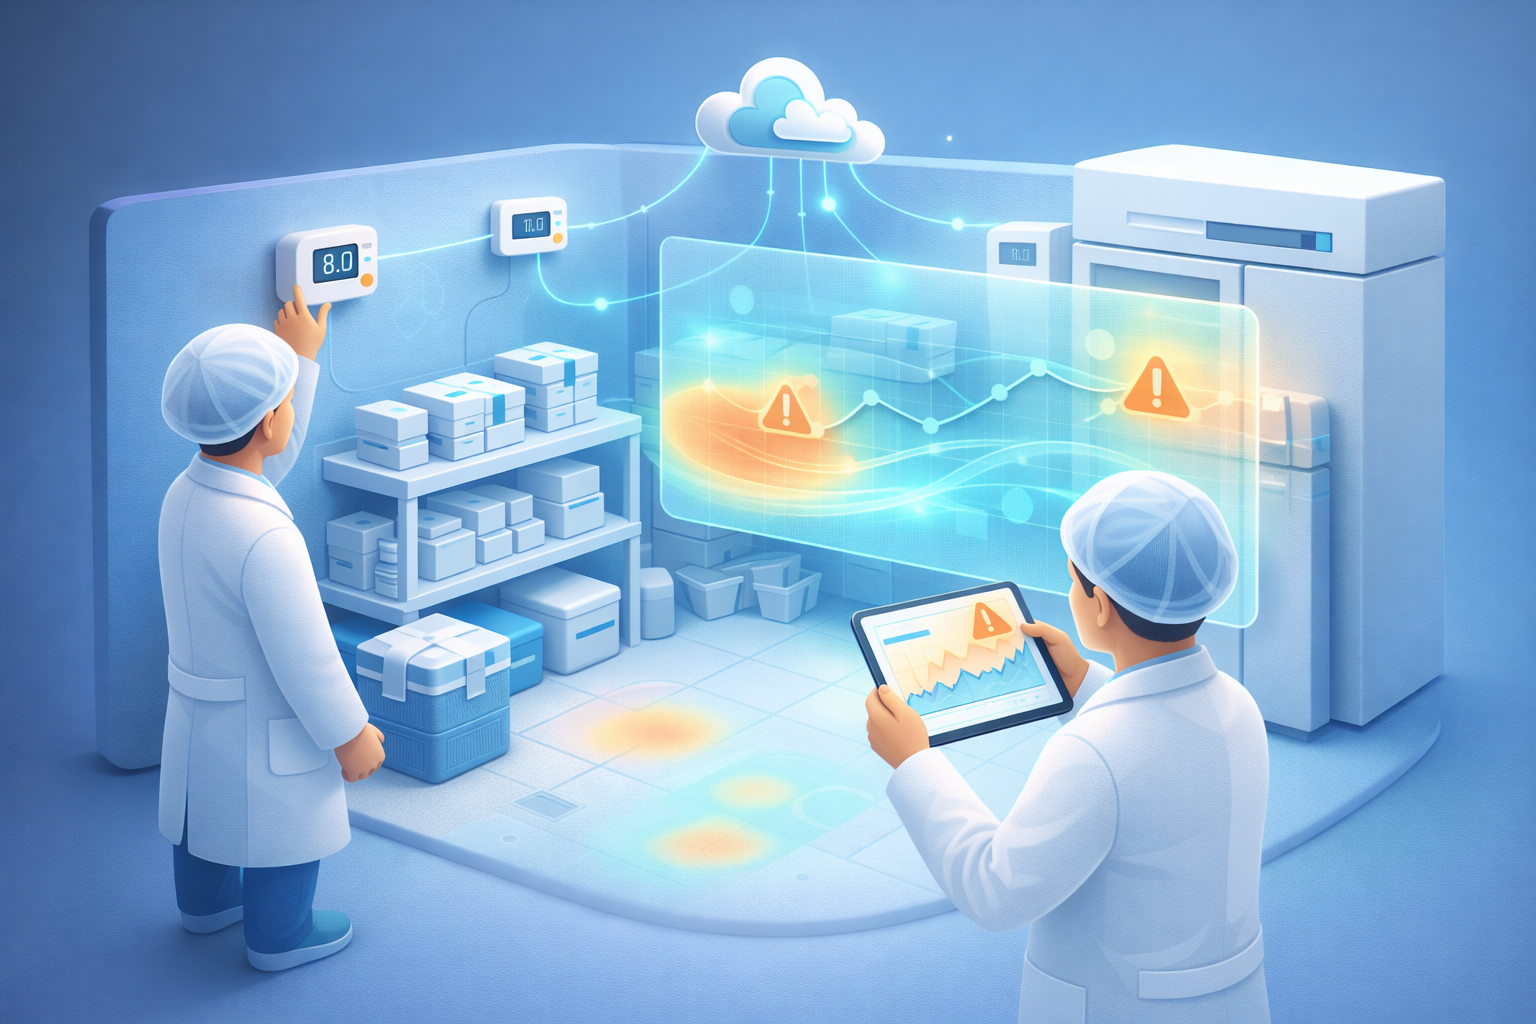
Continuous Temperature Mapping (cTM) is an AI-powered, real-time environmental mapping platform designed for GxP-regulated facilities.
Manual sensor placement and configuration required for every validation run.
Manual QA review and formatting required to generate validation reports.
Issues are detected only after the study is completed.
Fragmented data and human errors increase regulatory risk.
One-time sensor deployment with automatic connection and configuration.
Automated generation of GxP-ready reports with minimal manual intervention.
Predictive monitoring provides real-time alerts before issues escalate.
Built-in Part 11 / Annex 11 readiness with automatic validation and logging.
cTM combines IIoT sensors, machine learning, and predictive analytics to deliver real-time compliance intelligence. It transforms temperature mapping from a periodic burden into a continuous competitive advantage, enabling organizations to move from reactive compliance to proactive quality assurance.
Transform raw environmental data into actionable insights. Reduce manual processing, accelerate compliance reporting, and decrease mapping costs significantly.
Get Started NowcTM is an AI-powered continuous mapping solution designed for regulated environments. It ensures compliance, accuracy, and real-time visibility across your entire facilities infrastructure.
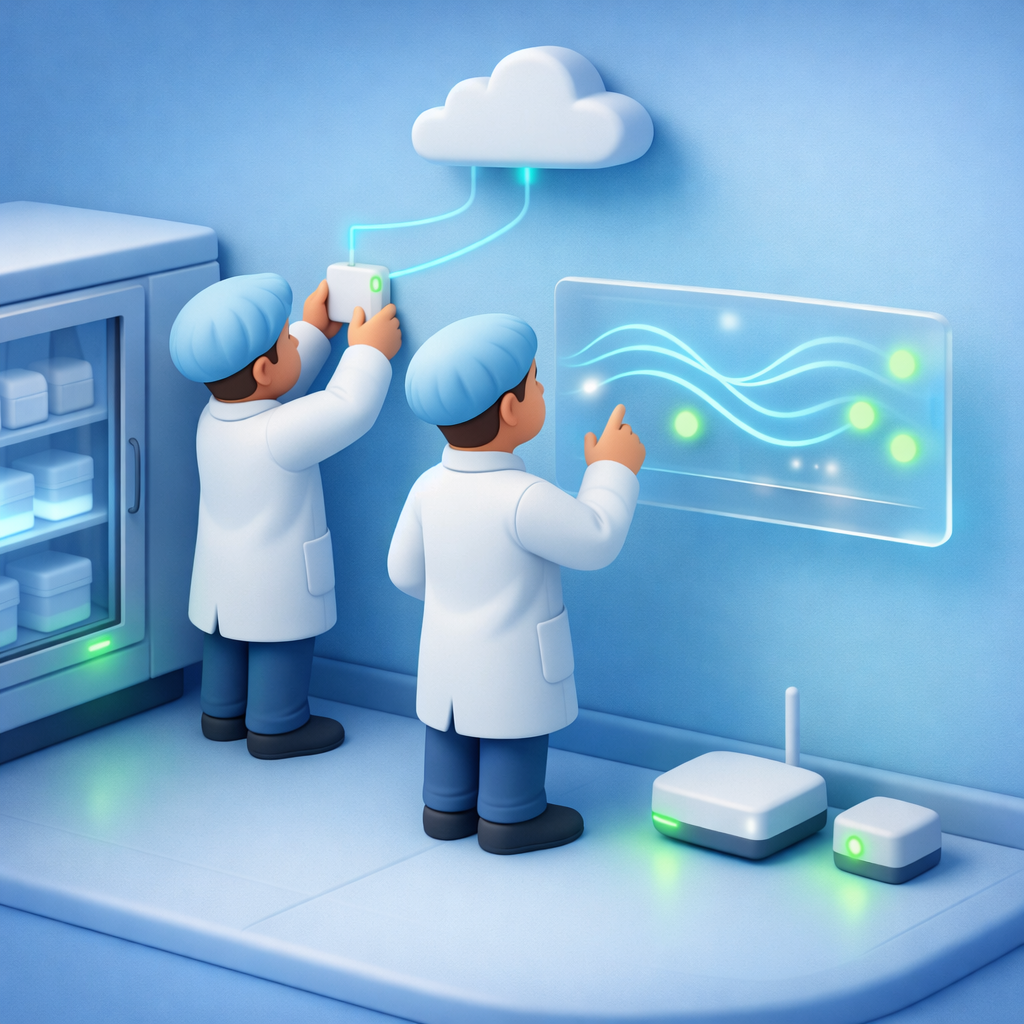
High-precision IoT sensors capture real-time temperature data across all storage locations, ensuring complete coverage of your cold chain with millisecond accuracy and automatic calibration.
24/7 uninterrupted monitoring streams data to our cloud platform, detecting even the slightest deviations from optimal temperature ranges before they become compliance issues.
Advanced machine learning algorithms validate sensor readings, filter noise, and identify patterns that human operators might miss, reducing false alarms by up to 90%.
Predictive analytics forecast potential excursions hours in advance, triggering smart alerts via SMS, email, or system integrations to prevent product loss and maintain GxP compliance.
Powered by advanced AI and machine learning, cTM delivers unparalleled accuracy and real-time insights for your mapping needs.
Chat with your data using natural language prompts, generating statistical analyses and visualizations on demand.
Predict future temperatures from historical data to enable proactive risk management and maintenance.
Generate GxP-compliant PDF reports with version control, audit trails, and secure e-signatures automatically.
Every action from data collection to report download is automatically logged, ensuring complete traceability and compliance.
Regulatory compliance-ready dashboards with complete audit trails and automated reporting for FDA and EU requirements.
AI-driven anomaly detection identifies temperature deviations instantly, preventing product loss and ensuring warehouse and cold chain integrity.
Transform your temperature mapping with powerful features designed for GxP compliance and operational excellence.

IoT-enabled sensors and cloud-based infrastructure ensure quick deployment with minimal manual effort.
AI/ML models validate environmental data with precision, ensuring reliability and compliance.
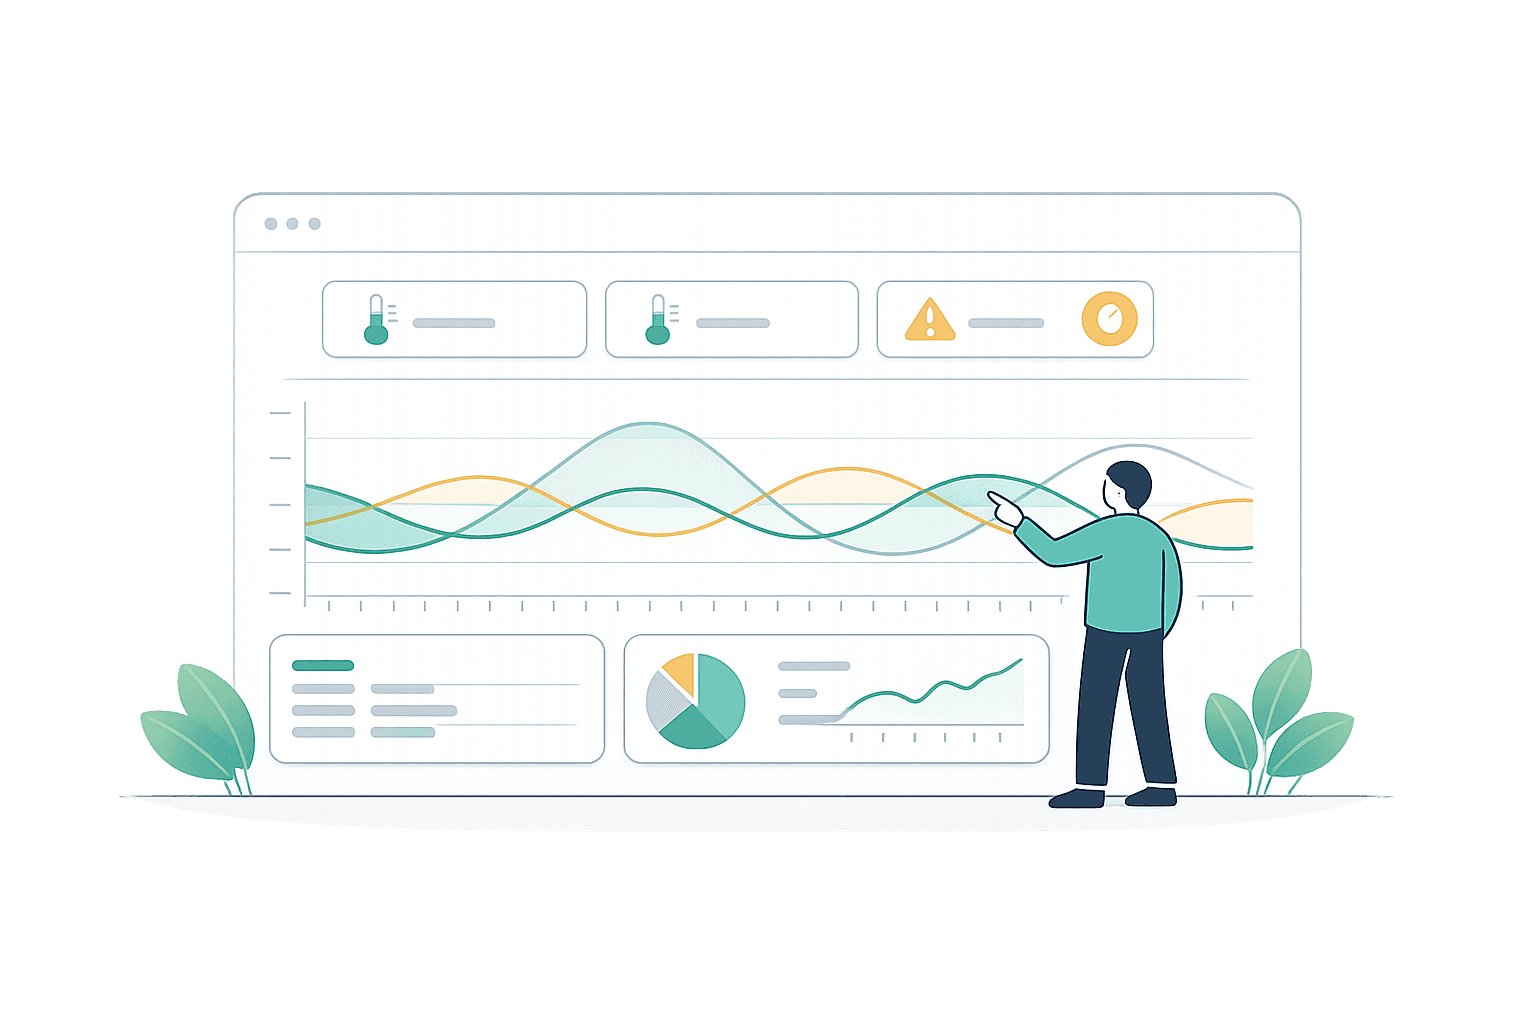
Transform raw data into meaningful insights with customizable dashboards. Monitor temperature trends, optimize operations, and scale seamlessly.
cTM is a state-of-the-art platform designed to transform how environmental data is captured, analyzed, and utilized with AI-powered precision.
With secure and scalable cloud infrastructure, cTM adapts to your growing monitoring needs without compromising performance or compliance.
See how life sciences companies are using cTM to ensure compliance, reduce costs, and transform their mapping.


“What specific features of xLM's solutions have been most beneficial to your team? In working with xLM, all solutions are robust, simple, efficient and compliant. The xLM team is collaborative and customer centric. xLM stands behind all deliverables and will go above and beyond to...”
Michael Magee
VP, Quality and Compliance, TRIS Pharma
“XLM has been an excellent resource for our project team by providing GxP compliance support on meticulous quality documentation, assistance with executing test plans and aiding in the closeout process. The organization is staffed with detailed oriented professionals that are well...”
David Rosby
Senior Project Manager, Johnson & Johnson

“I have worked with Nagesh and his team for many years, spanning several different large pharma companies in both the manufacturing and research quality spaces. Their system GxP capabilities and expertise in both system development and regulatory compliance is superior. They are t...”
Larry Puderback
AVP Research Quality, Merck
Explore expert insights, industry trends, and real-world perspectives on Continuous Mapping. AI-driven GxP compliance, and the future of continuous validation.
Watch how Continuous Temperature Mapping transforms real-time environmental monitoring with AI-powered insights and GxP compliance.
Find quick answers to common questions. We've compiled everything you need to know to help you get started.
cTM is a service designed for the MedTech, Biotech, and Pharma sectors that offers continuous mapping through automation, data handling, and machine learning. It streamlines the mapping process by automating everything from data collection to dashboard presentation with almost negligible human effort. Step 1: Calibrated RF dataloggers are placed in their mapping locations and linked to a gateway via the guest wireless network. These loggers can measure temperature and RH. Step 2: Data automatically flows into xLM's validated cloud. The end-user can log in to xLM's intelligent portal to view all the dashboards and reports needed to validate the mapping study. Step 3: The user can download GxP compliant reports in PDF format to meet their compliance requirements.
cTM employs data transformation techniques to convert raw data into a readable format, standardizing information from the dataloggers. The process includes data preprocessing with normalization methods like min-max scaling and z-score normalization, along with feature engineering to extract valuable insights from the data. Machine learning models facilitate predictive analytics for forecasting temperature trends and detecting anomalies, utilizing algorithms such as Isolation Forests and Local Outlier Factor.
cTM provides three types of dashboards, each serving a specific purpose: Temporary Sensors Dashboard: Designed for comprehensive analysis of NFC and RF datalogger information, this tool specializes in short-term data mapping. The software offers three essential capabilities: sophisticated deviation analysis, intuitive timeline visualization, and statistical T-test comparisons. These features enable users to effectively monitor, analyze, and interpret temporal data patterns. Fixed Sensors Dashboard: Utilizing data from permanently installed sensors, this dashboard delivers comprehensive thermal analysis, temperature pattern monitoring, and advanced visual tools designed for efficient anomaly detection and diagnosis. Sensor Mapping Dashboard: This dashboard includes analysis of data by comparing readings between fixed and temporary sensor installations. Through proximity-based clustering and detailed deviation graphs, it delivers comprehensive environmental surveillance and performance tracking.
cTM offers numerous advantages to streamline operations in highly regulated environments: Time Savings: Automated processes streamline operations by eliminating the need for manual data logging and reporting, resulting in enhanced efficiency and reduced human intervention. Error Reduction: Machine learning technology revolutionizes mapping by significantly improving data accuracy and substantially reducing measurement errors. This advanced computational approach ensures more precise and reliable mapping analysis results. Scalability: Highly adaptable and versatile, cTM seamlessly integrates into product storage areas of all sizes, effectively managing even the most complex storage environments. Proactive Monitoring: Predictive analytics empowers organizations to implement proactive measures, enabling timely interventions that prevent potential deviations before they occur.
Get access to AI-powered continuous monitoring, predictive analytics, and GxP-compliant dashboards. Everything designed to ensure compliance and operational excellence.
Contact Us